San Francisco International Airport Starts February 2022 with a Growth of Over 60% in Flight Movements
San Francisco International Airport (SFO/KSFO) - Photo source: Eater San Francisco
The second busiest airport in California, San Francisco International Airport (SFO/KSFO), has logged a growth rate of over 60% in the last two weeks as compared to last year.
From February 12 to 19, 6076 flights were reported, and an average of 868 flights per day, corresponding to a growth of 80.08% versus -58.34% in the same period of 2021.
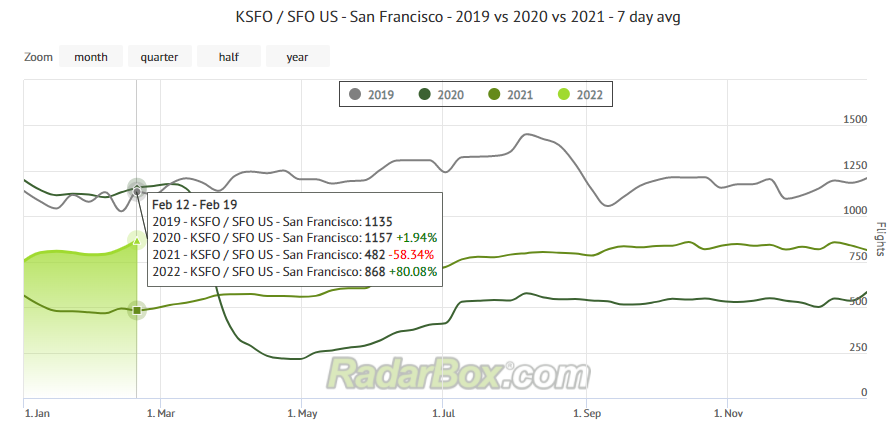
Flight statistics for San Francisco International Airport - February 12 -19
Numbers for February 6 to 12 reveal a 68% growth, corresponding to 5740 flights (820 daily). The figures for Feb 12-19 represent a growth of more than 336 flights over the previous week (Feb 6 - 12).
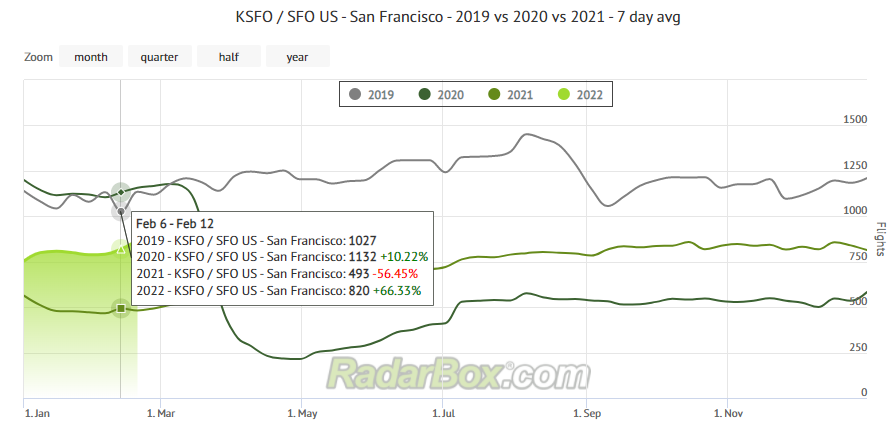
San Francisco International Airport Flight Statistics - February 6 - 12
Such figures represent 75% (Feb 12 -19) of the pre-pandemic levels and 72.3% (Feb 6 - 12) respectively. As the pandemic ceases, such growth is expected to increase further. Despite Omicron, the relaxation of sanitary measures continues, and, consequently, a greater demand for flights is expected.
Route Heatmap for San Francisco International Airport
According to AirNav RadarBox route heatmap for San Francisco Airport (SFO/KSFO), the top 10 most popular destinations are in the USA.
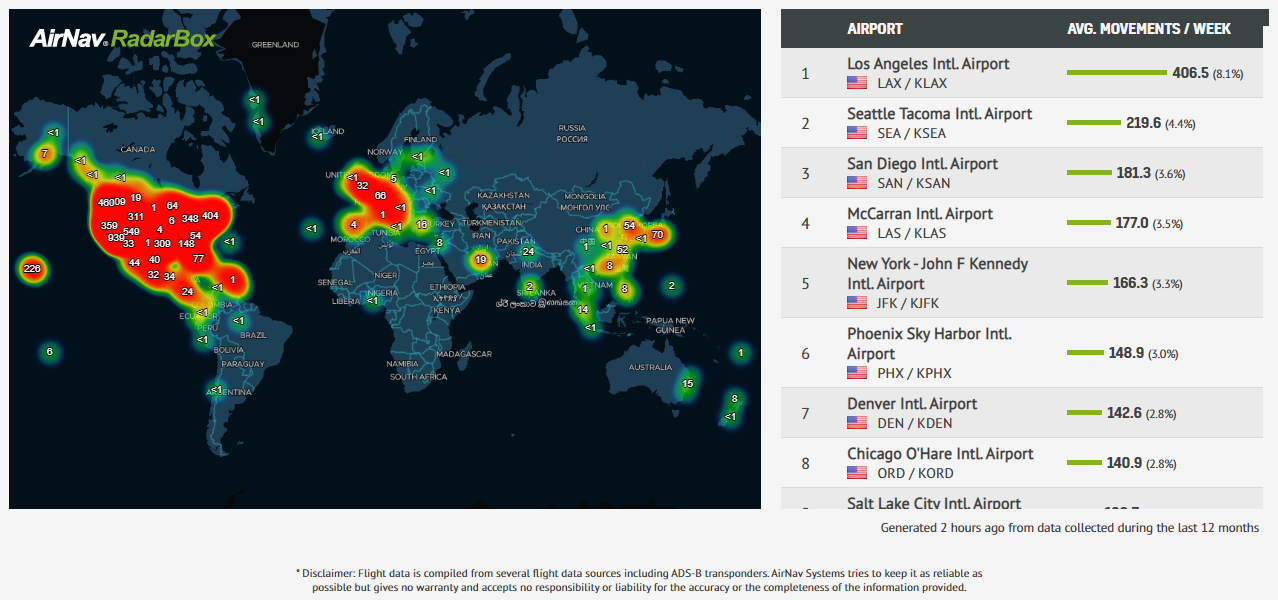
Heat Routemap for San Francisco International Airport (SFO)
Top 10 most popular destinations:
1st - Los Angeles Intl. Airport (LAX / KLAX) - Av. Movements/Week: 406.5 (8.1%)
2nd - Seattle Tacoma Intl. Airport (SEA / KSEA) - Av. Movements/Week: 219.6 (4.4%)
3rd - San Diego Intl. Airport (SAN / KSAN) - Av. Movements/Week: 181.3 (3.6%)
4th - McCarran Intl. Airport (LAS / KLAS) - Av. Movements/Week: 177.0 (3.5%)
5th - New York - John F Kennedy Intl. Airport (JFK / KJFK) - Av. Movements/Week: 166.3 (3.3%)
6th - Phoenix Sky Harbor Intl. Airport (PHX / KPHX) - Av. Movements/Week: 148.9 (3.0%)
7th - Denver Intl. Airport (DEN / KDEN) - Av. Movements/Week: 142.6 (2.8%)
8th - Chicago O'Hare Intl. Airport (ORD / KORD) - Av. Movements/Week: 140.9 (2.8%)
9th - Salt Lake City Intl. Airport (SLC / KSLC) - Av. Movements/Week: 130.7 (2.6%)
10th - Portland Intl. Airport (PDX / KPDX) - Av. Movements/Week: 122.0 (2.4%)
Find this and other flight statistics by clicking here.
READ NEXT...
 78745
78745Tracking Helicopters With RadarBox
Today we'll explore how to filter and track helicopters on RadarBox.com. Read this blog post to learn more...- 30345
AirNav Announces Coronavirus Related Data & Graphics Available
AirNav Systems is providing data COVID-19 air traffic related data for analysis, study and use. 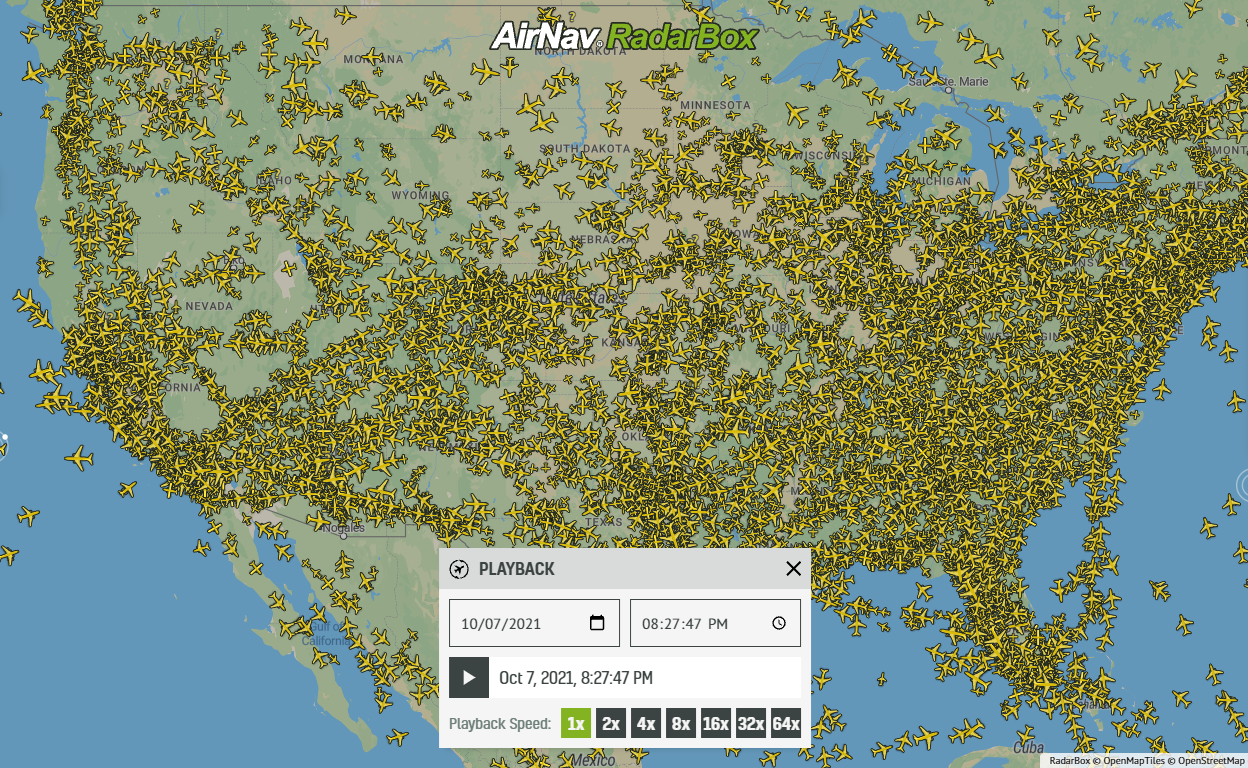 21813
21813Replay Past Flights with Playback
AirNav RadarBox officially launches the playback function on RadarBox.com, allowing users to replay the air traffic for a specific date and time in the past, within a 365-day period. Read our blog post to learn more about this feature.