The Top 10 Busiest Airlines and Airports in the US for the End of September and October 2023
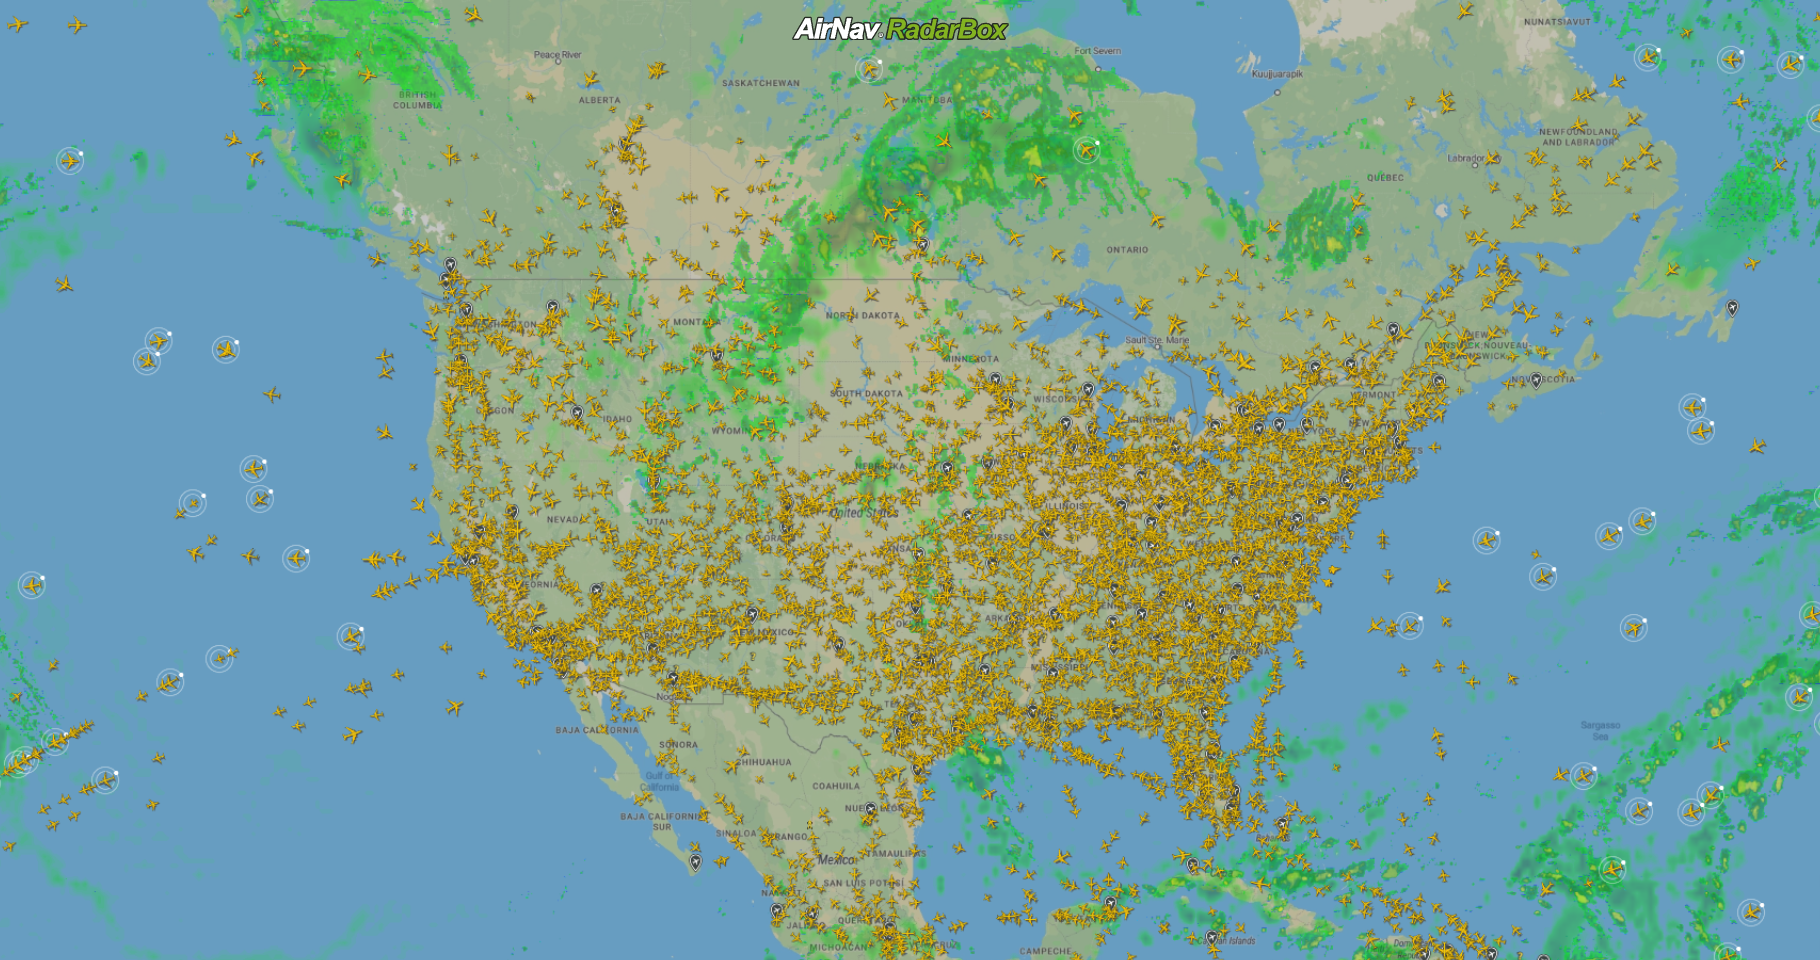
The U.S. is one of the busiest countries for air travel, with millions of flights taking off and landing each day. In this blog post, we'll look at the most active airlines and busiest airports in the US and the busiest city pairs for domestic flights.
Most active airlines
Most Active Airlines provided by AirNav RadarBox
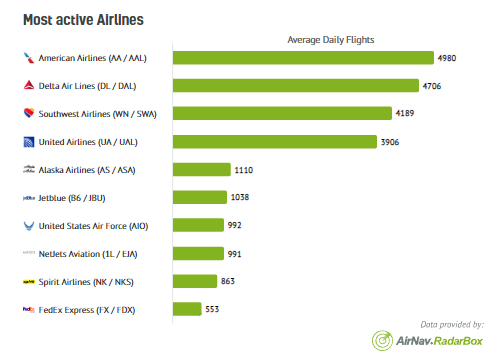
The following airlines are the most active in the US, based on the average number of daily flights from September 26-October 4, 2023:
- American Airlines (AA/AAL): 4980 Average Daily Flights
- Delta Air Lines (DL/DAL): 4706 Average Daily Flights
- Southwest Airlines (WN/SWA): 4189 Average Daily Flights
- United Airlines (UA/UAL): 3906 Average Daily Flights
- Alaska Airlines (AS/ASA): 1110 Average Daily Flights
- Jetblue (B6/JBU): 1038 Average Daily Flights
Busiest airports
Busiest Airports provided by AirNav RadarBox
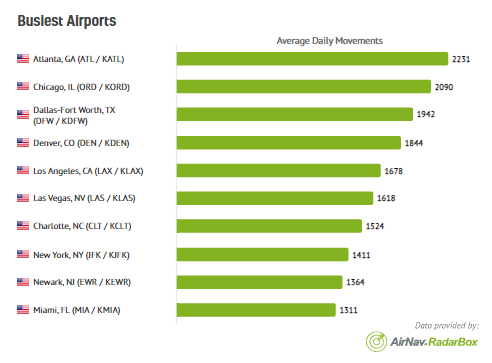
The following airports are the busiest in the US, based on the average number of daily movements in September 26-October 4, 2023:
- Atlanta, GA (ATL / KATL): 2231 Average Daily Movements
- Chicago, IL (ORD / KORD): 2090 Average Daily Movements
- Dallas-Fort Worth, TX (DFW/KDFW): 1942 Average Daily Movements
- Denver, CO (DEN / KDEN): 1844 Average Daily Movements
- Los Angeles, CA (LAX/KLAX): 1678 Average Daily Movements
- Las Vegas, NV (LAS / KLAS): 1618 Average Daily Movements
- Charlotte, NC (CLT/KCLT): 1524 Average Daily Movements
- New York, NY (JFK / KJFK): 1411 Average Daily Movements
- Newark, NJ (EWR/KEWR): 1364 Average Daily Movements
- Miami, FL (MIA / KMIA): 1311 Average Daily Movements
Busiest city pairs
Busiest City Pairs provided by AirNav RadarBox
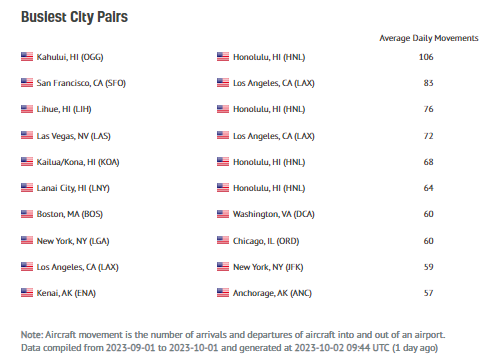
The following city pairs are the busiest for domestic flights in the US, based on the average number of daily movements from September 26-October 4, 2023:
- Kahului, HI (OGG) - Honolulu, HI (HNL): 106 Average Daily Movements
- San Francisco, CA (SFO) - Los Angeles, CA (LAX): 83 Average Daily Movements
- Lihue, HI (LIH) - Honolulu, HI (HNL): 76 Average Daily Movements
- Las Vegas, NV (LAS) - Los Angeles, CA (LAX): 72 Average Daily Movements
- Kailua/Kona, HI (KOA) - Honolulu, HI (HNL): 68 Average Daily Movements
- Lanai City, HI (LNY) - Honolulu, HI (HNL): 64 Average Daily Movements
- Boston, MA (BOS) - Washington, VA (DCA): 60 Average Daily Movements
- New York, NY (LGA) - Chicago, IL (ORD): 60 Average Daily Movements
- Los Angeles, CA (LAX) - New York, NY (JFK): 59 Average Daily Movements
- Kenai, AK (ENA) - Anchorage, AK (ANC): 57 Average Daily Movements
The U.S. is a vast country with diverse transportation options, but air travel remains one of the most popular ways to get around. The airlines and airports listed above are the busiest in the country and play a vital role in connecting people and businesses across the US.
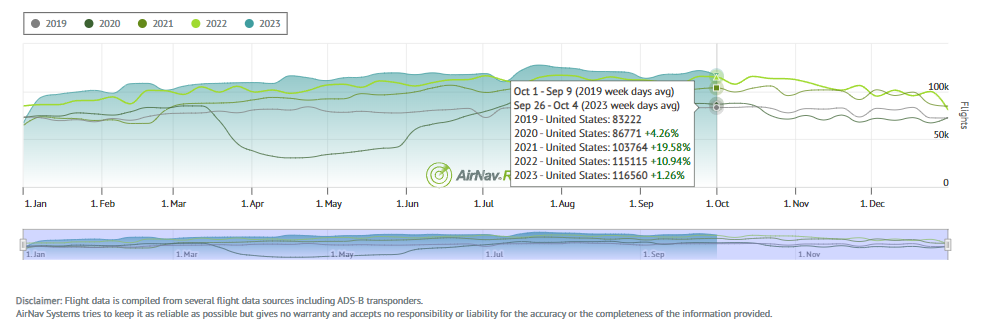
Historical United States Flight Activity by Year (7-day Average)
Flights have steadily increased by over 40% in just four years. Between September 24 and October 4, 2023, there were an average of 116,650 flights per day, or 816,550 for the week. This represents a significant increase from 2019 when there were an average of 83,222 flights per day, or 582,544 flights for the week.
This trend will likely continue in the coming years as more and more people choose to fly for business and leisure.
READ NEXT...
 78899
78899Tracking Helicopters With RadarBox
Today we'll explore how to filter and track helicopters on RadarBox.com. Read this blog post to learn more...- 52131
Air France Boeing 777 and American Airlines Boeing 737 experienced a near miss over Caribbean
Air France Boeing 777-300 and American Airlines Boeing 737-800 experienced a near miss over the Caribbean Sea. The planes were safely separated after the TCAS got activated. - 30356
AirNav Announces Coronavirus Related Data & Graphics Available
AirNav Systems is providing data COVID-19 air traffic related data for analysis, study and use.